
A volume that suddenly explodes at 3 a.m. on an illiquid pair. A token trading three times its average daily volume in a single hour, with no apparent news. These signals aren't meaningless. They often precede significant price movements, whether from manipulation, information leaks, or discreet institutional accumulation.
The problem? Most traders and analysts rely on standard volume alerts that generate too many false positives to be useful. High volume isn't necessarily an anomaly. What matters is the context: deviation from historical patterns, consistency with price movements, synchronization with other pairs.
Building an effective volume anomaly scanner requires understanding what you're actually trying to detect. It's not about capturing every volume spike, but identifying those that statistically stand out from the ambient noise of crypto markets and deserve deeper analysis.
Understanding what a volume anomaly really is
The first mistake is defining an anomaly as "volume above X times the average." This oversimplified approach ignores the cyclical nature of crypto markets. Volume on a BTC/USDT pair at 3 p.m. UTC on a Tuesday has nothing in common with Sunday at 2 a.m. Crypto markets operate 24/7, but activity follows predictable temporal patterns tied to the time zones of major traders.
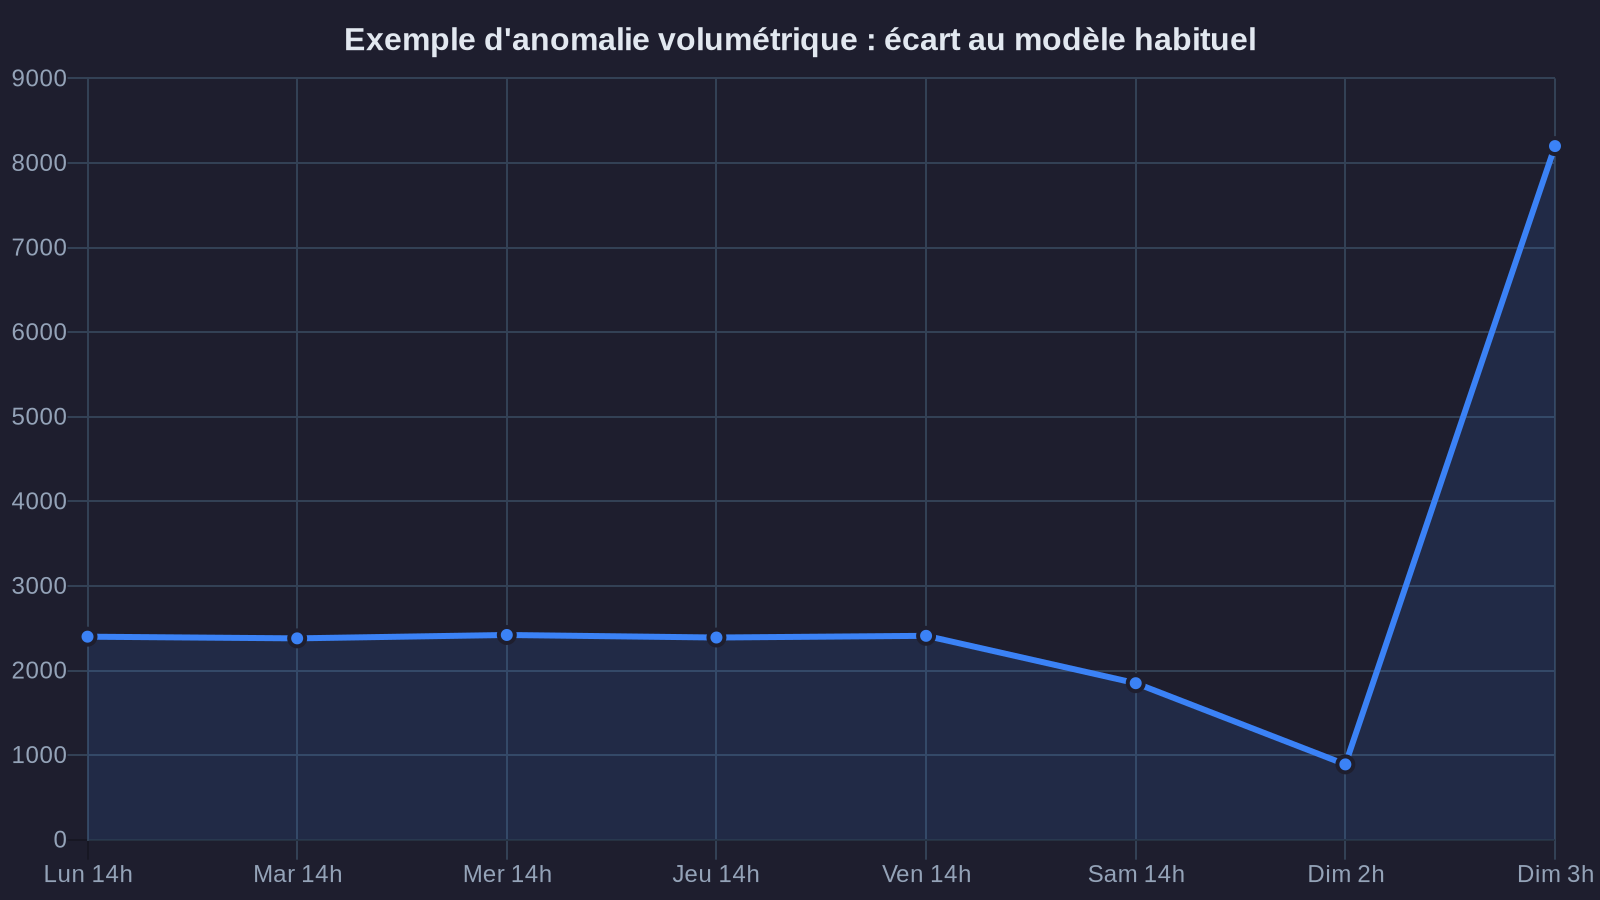
A relevant anomaly is better defined as a statistically significant deviation from expected behavior in a given context. This means precisely modeling that "expected behavior." Three types of anomalies generally warrant attention:
Isolated spikes represent sudden, massive volume over a very short period (minutes), often tied to large orders or cascade liquidations. These events create short-term trading opportunities, but also risks if you're on the wrong side.
Progressive increases show volume gradually rising over several hours, exceeding normal levels without a sharp spike. This pattern often suggests progressive accumulation or distribution—harder to detect but potentially more significant for upcoming price movements.
Synchronization anomalies involve abnormal volumes appearing simultaneously across multiple correlated pairs. This synchronization often reveals broader market movements, like sector rotations or macro events affecting the entire crypto market.
The technical architecture of a high-performance scanner for crypto volume analysis
Building a reliable detection system starts with quality data collection. Exchange APIs typically provide volume data aggregated by interval (1m, 5m, 1h), but they vary in granularity and latency. For near-real-time detection, websockets are preferred—they stream individual trades, letting you aggregate volume yourself with the necessary temporal precision.
Data normalization is a crucial step often overlooked. Raw volumes aren't directly comparable across pairs: a million dollars in BTC/USDT volume doesn't mean the same thing as on an exotic pair. Normalization typically uses a rolling median of volume over a reference period (for example, the median of the last 30 days, calculated for the same hour of day).
This approach produces a volume ratio that accounts for temporal patterns. A ratio of 3.0 means current volume is three times what you'd normally see at this time. This figure becomes comparable across different pairs and allows coherent detection thresholds.
Statistical analysis then relies on several complementary metrics. The Z-score measures how many standard deviations the current volume sits from the historical mean. A Z-score above 3 indicates a statistically significant anomaly (less than 0.3% probability in a normal distribution). But volume distributions on crypto markets are never perfectly normal. You complement this with percentiles: volume at the 99th percentile exceeds 99% of historical observations, without assuming a particular distribution shape.
Temporal pattern detection requires comparing the volume profile across different time scales. Is a 5-minute volume spike isolated, or part of an uptrend over the hour? This multi-scale analysis dramatically reduces false positives by filtering high-frequency noise.
From detection to interpretation: enriching context
A scanner that merely reports "abnormal volume detected" adds little value. The key is enriching these alerts with actionable context. Start by cross-referencing volume with corresponding price movement. Abnormal volume paired with minimal price change often suggests manipulation or wash trading. Conversely, moderate volume with significant price movement can indicate shallow order book depth and arbitrage opportunities.
Order book analysis usefully complements volume detection. A volume anomaly coinciding with a major imbalance between buy and sell orders reveals clear directional pressure. You can calculate a bid/ask volume ratio on levels near the market price to quantify this imbalance.
Correlation with other pairs also provides valuable clues. When a volume anomaly on ETH/USDT coincides with similar anomalies on ETH/BTC and other major altcoins, it suggests a broader market move rather than an isolated token event. Build a correlation matrix of anomalies to identify these market patterns.
On-chain data integration significantly strengthens analysis quality, especially for tokens with significant DeFi activity. Abnormal exchange volume coinciding with large token movements toward exchanges (detectable via on-chain transaction analysis) suggests an imminent sell-off. Conversely, massive withdrawals to non-exchange wallets during a high-volume phase suggest accumulation instead.
Managing false positives and refining anomaly detection
Even a well-designed system generates false positives. Crypto markets experience legitimate events that create volume spikes: exchange listings, partnership announcements, protocol updates. The key is distinguishing expected events from true anomalies.
An effective approach is maintaining a calendar of known events and temporarily adjusting detection thresholds around those dates. When a major token announces a scheduled protocol update for 2 p.m. UTC, you'd naturally expect high volume at that time. The anomaly would be the absence of volume.
Machine learning can improve detection, but with caution. Supervised learning models require manually labeled examples of "interesting" versus "uninteresting" anomalies, which demands substantial manual work. Unsupervised approaches like isolation forest or autoencoders detect statistical outliers without prior labeling, but don't guarantee these outliers correspond to trading opportunities.
In practice, a hybrid approach works well: simple statistical rules for initial detection, complemented by a scoring system that integrates multiple contextual factors (price-volume consistency, inter-pair correlation, on-chain data). This score prioritizes alerts for human analysis, rather than seeking complete automation that often misses important nuances. This method applies equally to crypto derivatives markets and spot platforms.
Continuous system validation is essential. Track metrics like false positive rate (alerts leading nowhere), but also false negative rate (significant price movements you missed). The latter is harder to measure but equally critical. You can do this by retrospectively analyzing major price moves and checking whether the scanner had detected prior volume anomalies.
Production deployment: infrastructure and maintenance
A high-performing anomaly scanner in research isn't necessarily performant in production. Latency becomes critical: detecting an anomaly 30 seconds late can make all the difference in fast-moving markets. This requires distributed architecture where processing happens as close to the data source as possible, typically via dedicated workers per exchange.
Historical data storage directly influences detection quality. You typically maintain two data types: aggregated volume time series (for historical reference calculation) and detected anomaly events (for post-mortem analysis). Time-series databases like InfluxDB or TimescaleDB efficiently handle the former, while a standard relational database suffices for events.
Alert management deserves special attention. Bombarding users with notifications quickly leads them to ignore them. Implement multiple severity levels (critical, high, medium) and filtering options by pair, anomaly type, or minimum score. Critical alerts go to real-time channels (Telegram, Discord), while lower-severity alerts can be consulted in a dashboard.
System maintenance requires discipline. Market patterns evolve: what was anomalous six months ago may become the new norm. Regularly recalculate statistical references and adjust thresholds as needed. Market structure changes (dominant new exchange, new popular trading pairs) also require adaptation. These evolutions affect both crypto fintechs and traditional exchanges.
Human analysis remains indispensable
The best anomaly detection systems don't replace human judgment—they amplify it. An effective scanner saves considerable time by automatically filtering out 99% of market noise, allowing the analyst to focus on the 1% truly worthy of attention. But the final interpretation of these signals, their contextualization within the broader market situation, and the decision to act remain fundamentally human.
This hybrid approach also enables continuous system improvement. Each time an analyst identifies a relevant anomaly the scanner missed, or conversely marks an alert as a false positive, this information enriches understanding of market patterns and can be fed back into the system.
Crypto markets evolve faster than any other financial market. Manipulation strategies grow more sophisticated, new types of actors emerge, liquidity structures change. An anomaly scanner frozen in its rules quickly loses relevance. The challenge is building an adaptable system where detection rules can be rapidly adjusted based on field observations, while maintaining a solid statistical foundation that avoids over-reacting to short-term noise.