
You've probably already heard about volatility, the Sharpe ratio, perhaps even Value at Risk. These metrics dominate most conversations about risk management. Yet a fundamental question often remains unanswered: how much could you realistically lose before recovering your initial capital?
That's precisely what drawdown measures. And in the world of crypto-assets, where 50% corrections are not statistical anomalies but recurring events, this risk metric takes on critical importance for wealth management.
Let me show you why drawdown should occupy a central position in your portfolio management dashboard—backed by concrete figures.
What drawdown really reveals about your portfolio management
Maximum drawdown measures the largest cumulative loss between a historical peak and the lowest point that follows, before a new peak is reached. Unlike volatility, which aggregates variations in both directions, drawdown captures the actual magnitude of a wealth decline.
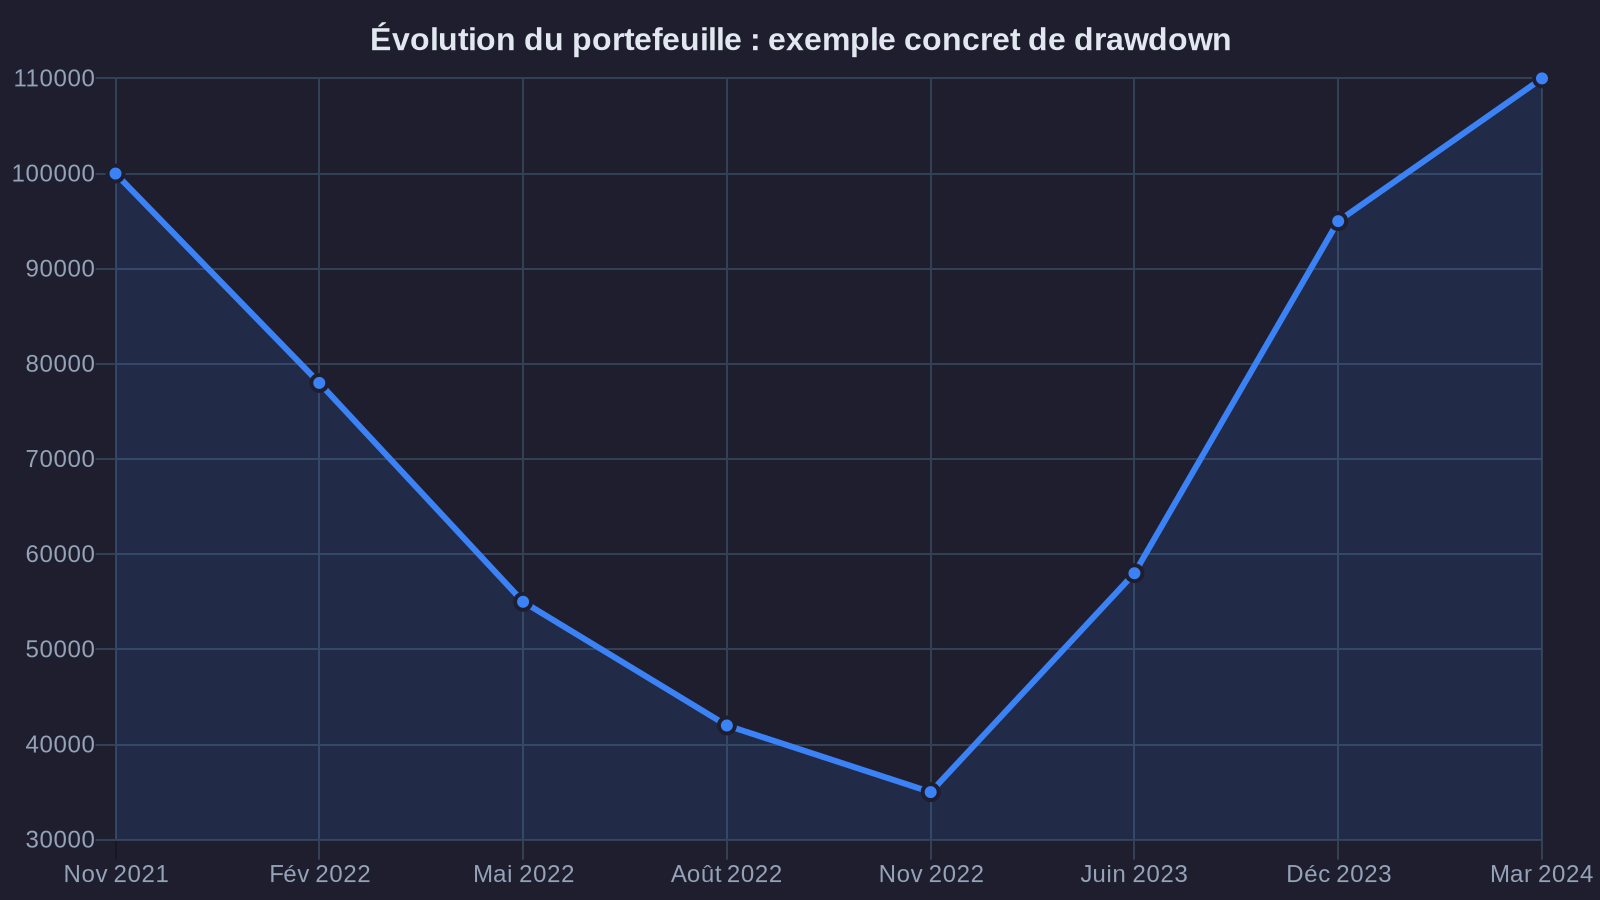
Take a concrete example. Your portfolio is worth €100,000 in November 2021. It gradually falls to €35,000 in November 2022, then rebounds to €110,000 in March 2024. The maximum drawdown is 65% (€100,000 → €35,000). This information is far more meaningful than an annual standard deviation of 78%.
Why is this distinction critical? Because your ability to maintain an investment strategy doesn't depend on abstract variations, but on your psychological resilience in the face of real losses. A 65% drawdown means you'll need a 186% gain just to break even. This mathematical asymmetry escapes many investors until they experience it firsthand, particularly in high-risk DeFi environments.
In my work as a wealth advisor, I observe that clients who abandon their strategies rarely do so because of theoretical volatility. They exit when their capital has dropped 40%, 50%, or 60%, and the recovery seems unreachable. Drawdown predicts this breaking point better than any other metric.
Drawdown vs volatility: why these two performance metrics don't measure the same thing
Portfolio volatility (standard deviation of returns) remains the benchmark indicator in traditional finance. It measures the dispersion of performance around the average, whether gains or losses. An asset with 60% annual volatility might experience alternating +15% and -12% moves, or a sharp -45% decline followed by a +30% rebound.
Drawdown, conversely, focuses exclusively on downward trajectories. It answers a direct wealth management question: how much capital have I lost relative to my peak? This distinction is far from academic.
Compare two portfolios over 2020-2024:
Portfolio A (100% Bitcoin)
• Annual volatility: 72%
• Maximum drawdown: 76% (Nov 2021 → Nov 2022)
• Duration underwater: 23 months
• Final performance: +280%
Portfolio B (60% stablecoins lending / 40% Bitcoin)
• Annual volatility: 31%
• Maximum drawdown: 34% (Nov 2021 → Nov 2022)
• Duration underwater: 14 months
• Final performance: +165%
Volatility tells you that portfolio B is twice as stable. Drawdown tells you that with portfolio A, you would have seen your €100,000 capital drop to €24,000, and you would have waited nearly two years to recover your initial investment. With portfolio B, the decline stops at €66,000, and you recover your capital nine months sooner.
These insights belong to different decision-making categories. The first speaks to statistics. The second speaks to wealth and your ability to maintain a strategy over time.
Practical application: calculating and interpreting your allocation's drawdown
Calculating maximum drawdown requires a history of daily valuations. For each point in the history, you calculate the loss relative to the previous peak. Maximum drawdown is the largest of these observed losses.
Here's how to proceed with your crypto portfolio:
Step 1: Collect your daily valuations
Most platforms (Binance, Kraken, Ledger Live) allow you to export history. If you use multiple wallets, consolidate them in a spreadsheet. You need a "Date" column and a "Total Value in euros" column.
Step 2: Calculate the rolling peak
For each row, identify the maximum value reached up to that date. In Excel: =MAX($B$2:B2) (lock the first cell, not the second).
Step 3: Calculate current drawdown
For each date: (Day's Value - Rolling Peak) / Rolling Peak. This gives you a negative or null percentage.
Step 4: Identify maximum drawdown
This is the most negative value in your entire series. It's your maximum observed wealth loss.
Let me share a real case I managed. A client holds a €150,000 portfolio allocated as follows: 50% ETH, 30% stablecoins in lending (Aave, average rate 4.2%), 20% Layer 2 tokens (Arbitrum, Optimism). Over March 2024 - March 2025, his maximum drawdown reached 28%, occurring in August 2024 during the broad market correction.
This information enables several strategic adjustments:
• Reduce Layer 2 allocation (individual drawdown of 52% over the same period) in favor of stablecoins
• Implement a rebalancing rule: if drawdown reaches 35%, mechanically increase the lending allocation from 30% to 45%
• Adjust return expectations: target 12-15% net annual rather than 25%, but with a drawdown target under 30%
These decisions cannot be made with volatility alone. They require understanding the depth and duration of real losses.
Two dimensions of drawdown that investors forget
Maximum drawdown captures the magnitude of loss. But there's a second dimension equally critical: duration underwater—the time required to recover to the previous peak.
A portfolio can show a modest 25% drawdown yet remain below its peak for 18 months. Conversely, a 40% drawdown can be absorbed in 6 months if the recovery is vigorous. These two risk profiles call for different wealth management approaches.
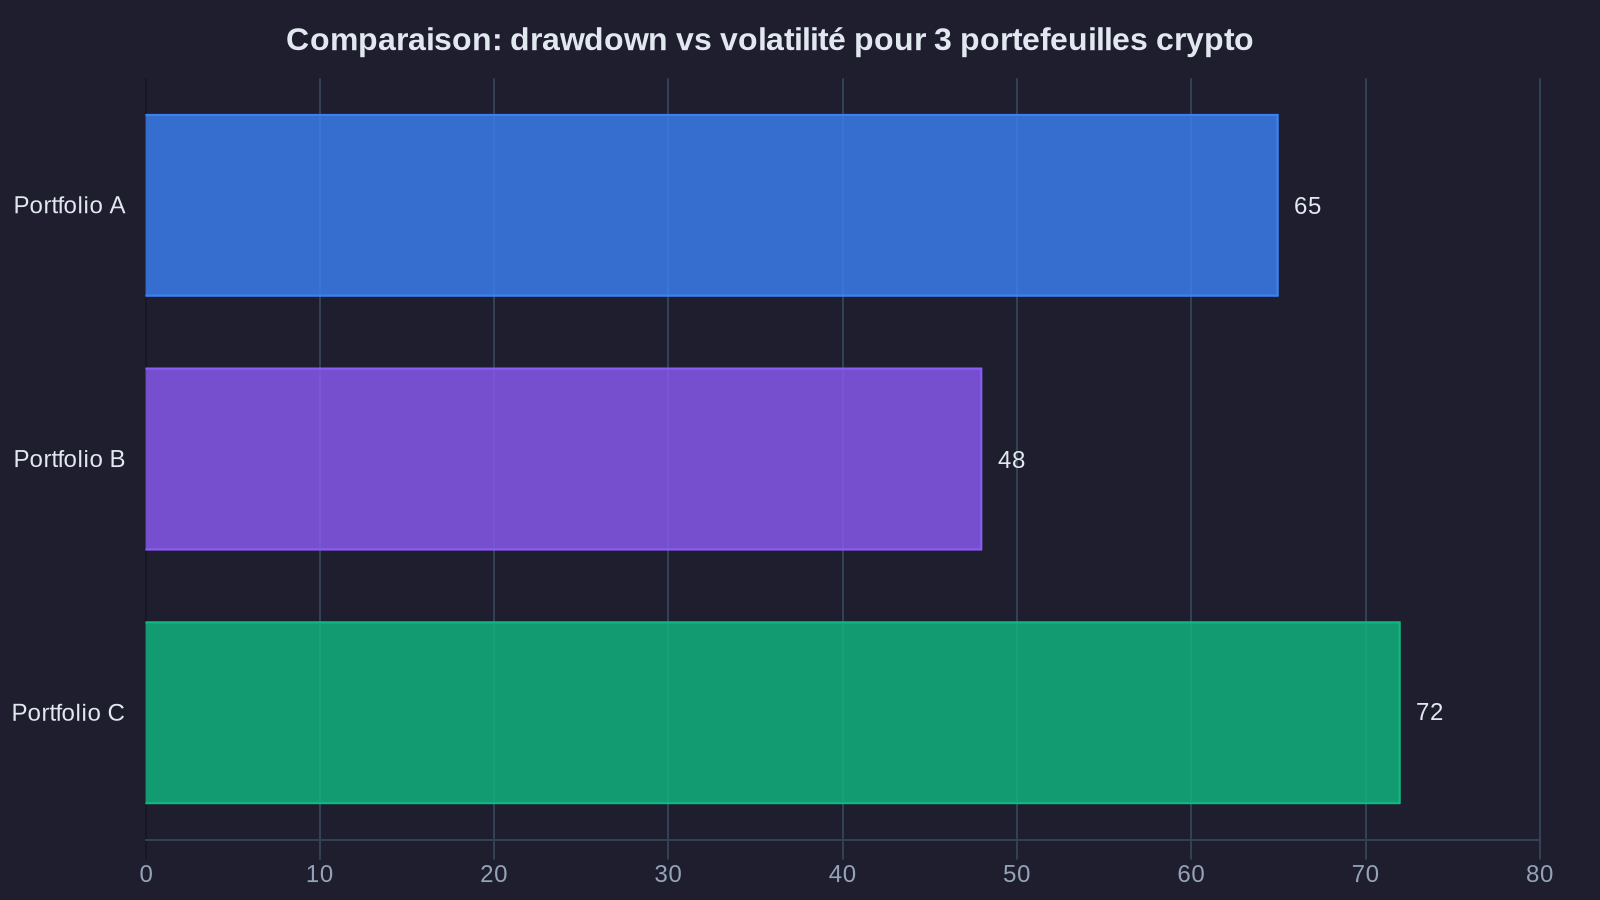
Let's look at three typical profiles in the crypto market (2022-2024):
Profile 1: Pure Bitcoin
• Max drawdown: 76%
• Duration underwater: 23 months (Nov 2021 → Oct 2023)
• Characteristic: maximum amplitude, slow but reliable recovery
Profile 2: Diversified portfolio (40% BTC / 40% ETH / 20% stablecoins lending)
• Max drawdown: 58%
• Duration underwater: 19 months
• Characteristic: reduced amplitude, similar duration (diversification limits the fall but not the duration)
Profile 3: Yield strategy with protection (70% stablecoins lending / 30% BTC)
• Max drawdown: 24%
• Duration underwater: 11 months
• Characteristic: contained amplitude and duration, at the cost of reduced final performance
If you have €200,000 to allocate and cannot psychologically accept seeing your capital drop below €140,000 for more than a year, profile 3 is objectively better suited, even if its final performance (+68% over 3 years) lags profile 1 (+180% over the same period).
This analysis isn't about market timing or forecasting. It's about wealth engineering: building a portfolio whose actual risk profile matches your resilience capacity. Drawdown and its duration are the only metrics that allow this calibration with precision.
Building an asset allocation based on your tolerable drawdown
The methodology I systematically apply with my clients starts with an initial question: what percentage of maximum loss are you willing to accept before questioning your strategy?
This question doesn't call for a theoretical answer ("I'm a long-term investor, I can handle 60%"), but a concrete wealth management answer. If you have €100,000, can you watch it drop to €40,000 and maintain your asset allocation without intervening? If the answer is no, your tolerable drawdown is less than 60%.
Once this threshold is established, allocation is built by risk tiers:
Tier 1: Capital preservation (drawdown target 0-5%)
Stablecoins on established lending protocols (Aave, Compound). Current yield: 3.8-5.2% depending on USDC/USDT pools. This tier absorbs shocks and generates a floor return, though freezing risks exist even on centralized stablecoins.
Tier 2: Moderate yield (drawdown target 15-25%)
ETH staking via Lido or Rocket Pool. Yield: 3.2-3.8% + potential ETH appreciation. ETH's maximum historical drawdown: 82% (May 2022). But with a mixed allocation (50% stablecoins / 50% staked ETH), effective drawdown drops to 35-40%.
Tier 3: Growth (drawdown target 40-60%)
Bitcoin, established Layer 1 or Layer 2 tokens. Expected yield: variable, heavily correlated with market cycles. This tier targets capital appreciation over 3-5 years.
Example allocation for tolerable drawdown of 30% on €150,000:
• 60% stablecoins lending (€90,000) → expected drawdown 2-5%
• 25% staked ETH (€37,500) → expected drawdown 35-45% on this portion
• 15% Bitcoin (€22,500) → expected drawdown 50-70% on this portion
Weighted portfolio drawdown: approximately 28-32% depending on stress periods.
This construction allows targeting overall net annual yield of 7-11% (4.5% on stablecoins, 3.5% on staked ETH, variable on BTC), with controlled risk profile. You know in advance that in the worst historically observed scenario, your €150,000 portfolio won't fall below €105,000.
It's this risk predictability that enables maintaining a strategy over time. Investors who capitulate rarely do so because they've misjudged expected returns. They capitulate because they've underestimated the drawdown they'd have to weather to achieve it.
What this means for your wealth
Drawdown isn't just one more metric to monitor. It's the indicator that translates statistical risk into wealth reality. You're not managing a standard deviation; you're managing capital that could drop from €100,000 to €60,000, €40,000, or €25,000 depending on your allocation.
Volatility tells you the path will be bumpy. Drawdown tells you how far you might drop and how long you'll wait to recover. These two pieces of information aren't interchangeable.
If you hold crypto-assets or plan to integrate them into your wealth, start with this simple question: what drawdown are you willing to endure? Not in theory, not "because it's long-term investing," but concretely, on your capital. Then build your allocation based on this constraint.
Your wealth deserves better than an improvised allocation. It deserves engineering that incorporates real risk, not just expected returns. Drawdown is the tool that makes this engineering possible—backed by solid figures.


