
You've probably looked at the risk profile of your investments before. A scale of 1 to 7, some mention of volatility, maybe a chart showing historical swings. These indicators give you an abstract sense of risk. But they don't answer the question that really matters: how much can I actually lose if markets turn against me?
That's precisely what drawdown measures. This risk metric calculates the maximum loss suffered between a peak and a subsequent trough in your investment portfolio. In other words, it tells you what you would have lost if you'd invested at the worst moment and sold at the worst moment. For an investor, that's the most concrete information available.
Yet drawdown remains conspicuously absent from most financial communications. Fund managers prefer discussing volatility, advisors highlight average performance, and regulatory disclosures bury real risk in technical jargon. The result: you're building your wealth with only a partial view of the risk you're actually taking.
What drawdown reveals (and what volatility hides)
Volatility is the most widely used risk metric in finance. It measures how widely an asset's price fluctuates around its average. A volatility of 15% means the price typically varies within a ±15% range around its central trend. It's mathematically elegant, easy to calculate, and lets you compare different assets.
The problem is that volatility treats gains and losses the same way. An asset that rises 20% then falls 10% is considered just as volatile as one that drops 20% then rebounds 10%. But as an investor, you don't experience these two scenarios identically. The 20% decline costs you money. The 20% gain makes you money. It's not symmetrical.
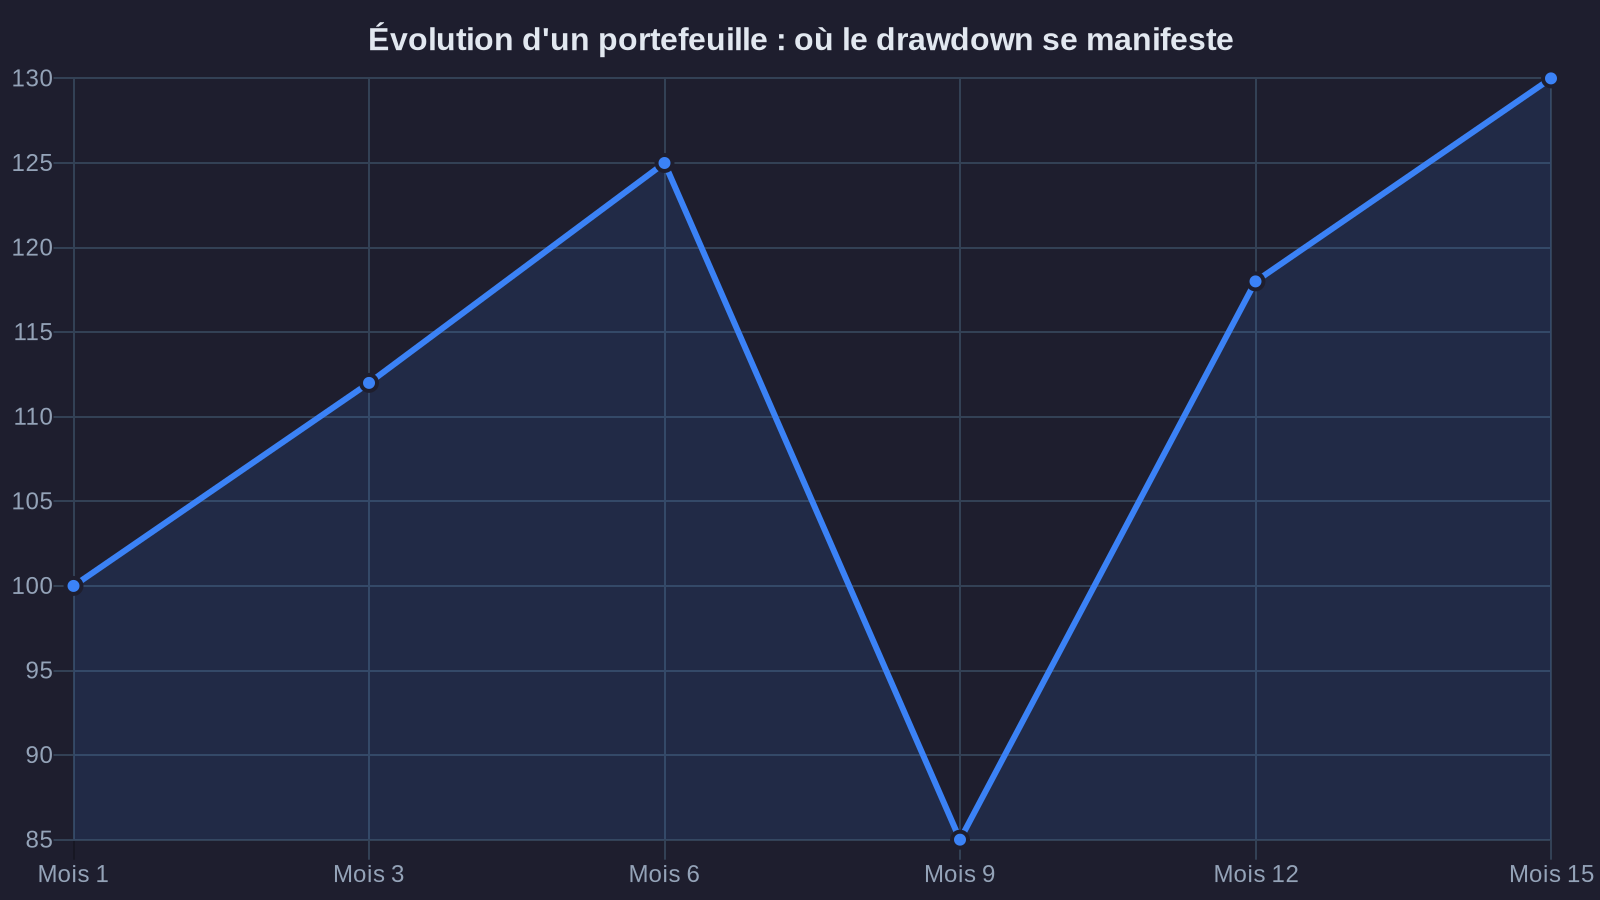
Drawdown, by contrast, focuses solely on losses. It measures the gap between your portfolio's peak and the lowest point that follows. Let's use a concrete example. You invest €100,000 in January 2020. Your portfolio grows to €115,000 by February, then crashes to €85,000 in March due to the Covid shock. The drawdown is 26% (calculated from the peak of €115,000, not from your initial investment). That €30,000 drop is what you actually experienced. It's what made you hesitate, lose sleep, maybe sell at the worst time.
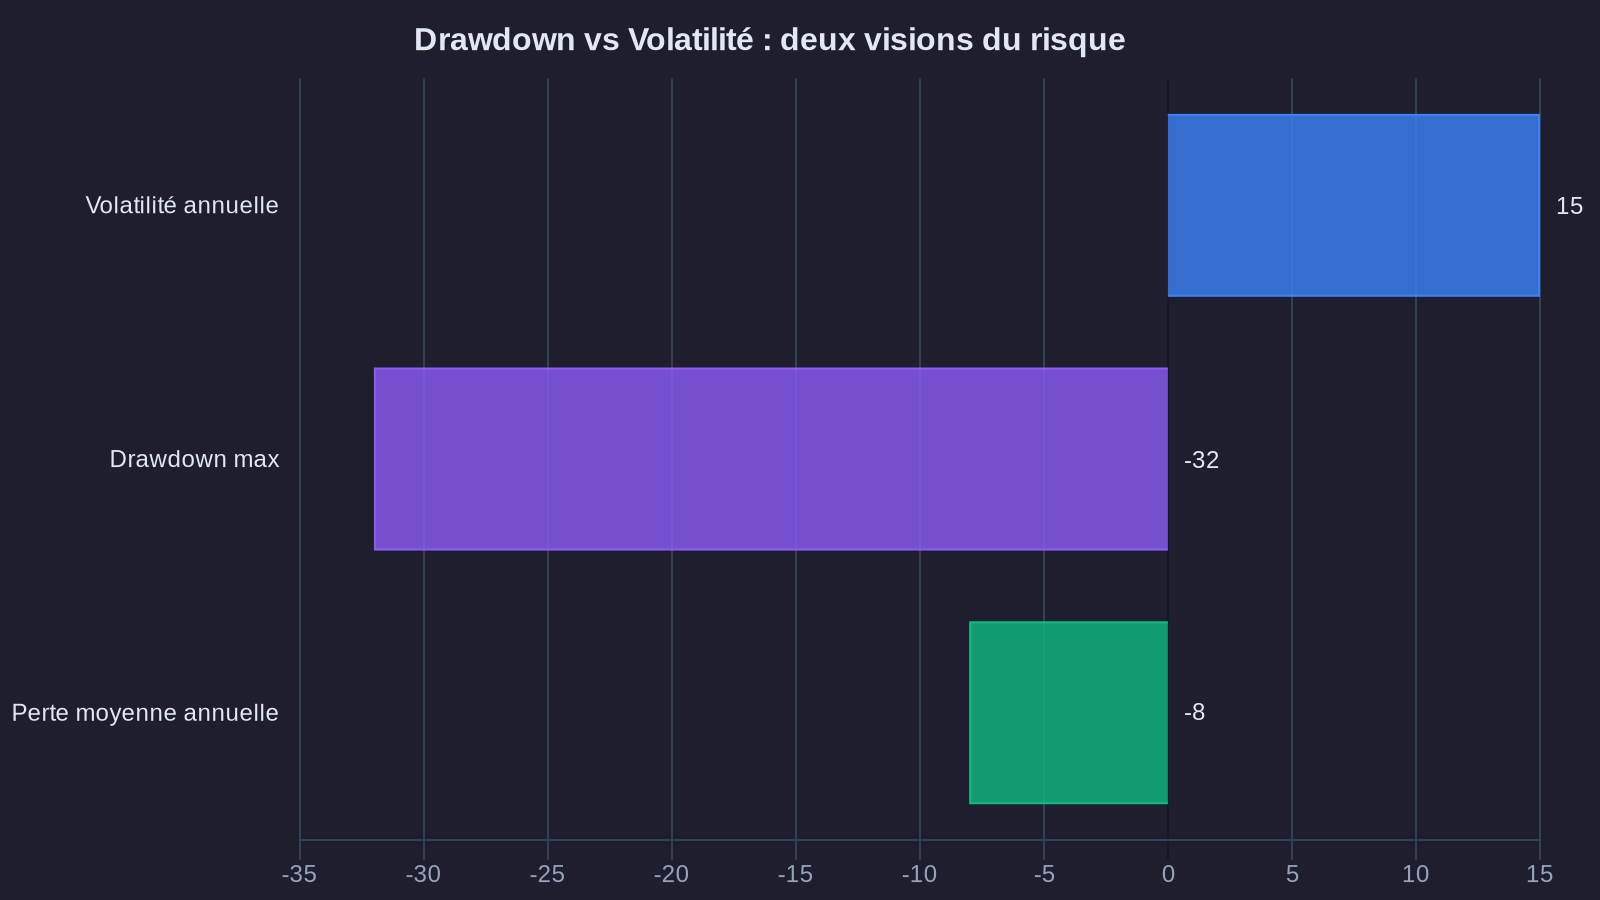
A portfolio might show moderate volatility of 12% over five years while suffering a 35% drawdown during a specific crisis. Volatility tells you the portfolio is "relatively stable." Drawdown tells you that at a given moment, you lost more than a third of your capital. These two pieces of information tell very different stories.
How to calculate your portfolio's drawdown (with concrete figures)
Calculating drawdown is straightforward. You take the maximum value your portfolio reached at time T, then measure the decline to the lowest point that follows, before the portfolio climbs back above that peak. The formula:
Drawdown = (Value at peak - Value at trough) / Value at peak
Let's use the example of a 60% stocks / 40% bonds blended portfolio, with an initial €200,000 investment in January 2022. Here's what happened over the following 24 months:
- January 2022: €200,000 (initial investment)
- March 2022: €215,000 (+ 7.5%, year-start recovery)
- October 2022: €168,000 (- 21.9% from peak, rough year for stocks and bonds)
- December 2023: €208,000 (partial recovery)
- March 2024: €227,000 (new peak)
This portfolio's maximum drawdown was 21.9%, representing a €47,000 loss from the March 2022 peak. This tells a far more meaningful story than an annualized volatility of 13%. It shows what you actually experienced. And crucially, it lets you assess whether you'd have had the conviction to hold through it.
Because that's the whole point: a drawdown isn't just a temporary dip. It's a test of conviction. During those months of decline, you don't know where the bottom is. You watch your capital shrink without knowing when it will stop. That's when most investors sell, often at the worst moment, locking in their losses.
Drawdown and recovery time: the other dimension of risk
Drawdown isn't just about the size of the decline. You also need to measure how long it takes to recover. This duration is rarely highlighted, yet it determines whether an investment strategy is actually practical.
Back to our 60/40 portfolio. The maximum drawdown of 21.9% occurred in October 2022. It took until March 2024—17 months—for the portfolio to climb back above its previous peak. For nearly a year and a half, your capital was lower than it had been before. If you'd needed cash during that period, you'd have sold at a loss.
This recovery period varies greatly depending on portfolio composition. A 100% U.S. tech stocks portfolio took about 15 years to recover to pre-dot-com bubble levels (March 2000 - April 2015). A diversified global stocks/bonds portfolio recovered in 4 years after the 2008 crisis. A portfolio with first-generation crypto exposure can see drawdowns exceeding 70% and take years to recover—a reality confirmed by DeFi risk analysis.
This time dimension is crucial for calibrating your allocation. If your investment horizon is 5 years, an asset that needs 7 years to recover isn't suitable, regardless of its expected return. It's this combined analysis—drawdown magnitude AND recovery duration—that lets you build a portfolio truly aligned with your situation.
Practical application: comparing two allocations using drawdown
Let's consider two allocation profiles for a €150,000 portfolio with an 8-year horizon:
Portfolio A – Conservative
- 50% euro investment-grade bond fund
- 30% global stocks (MSCI World)
- 20% money market fund
Portfolio B – Dynamic
- 70% global stocks
- 20% European small caps
- 10% diversified crypto allocation (BTC/ETH/stablecoins in staking)
Based on historical data and stress test simulations, here's what these two portfolios might experience during a major correction:
Portfolio A: estimated maximum drawdown of 18–22%, recovery duration of 12–18 months. In concrete terms, on €150,000, this means a possible decline to €117,000, or a temporary loss of €33,000.
Portfolio B: estimated maximum drawdown of 45–55%, recovery duration of 3–5 years. On €150,000, this could mean dropping to €67,500, or a temporary loss of €82,500.
These figures change the perspective. Portfolio B shows a higher expected long-term return (9–11% annualized versus 4–5% for Portfolio A). But it exposes you to temporary losses 2.5 times larger, with a far longer recovery period. If you need access to this capital in 4 or 5 years, or if seeing your portfolio lose €80,000 would panic you into selling, then Portfolio B isn't for you, regardless of its theoretical return.
That's the whole difference between a strategy that looks attractive on paper and one you can actually stick with over time. Drawdown forces you to imagine the difficult scenario. It transforms risk into a concrete question: "Am I prepared to see my capital drop by X euros for Y months?"
What this risk metric means for your wealth
Drawdown isn't a theoretical metric reserved for fund managers. It's the indicator that lets you calibrate your allocation based on your reality: your liquidity needs, your investment horizon, and above all your psychological capacity to weather declines.
Before committing to an investment strategy, ask yourself: what's the maximum drawdown this portfolio could suffer, and how long will recovery take? If the answer gives you pause, the allocation is probably too aggressive for you. A portfolio with slightly lower returns that you'll actually hold through to the end beats an ambitious strategy you'll abandon at the first crash.
Your wealth deserves better than a savings account. I'll show you the path, backed by the numbers.


